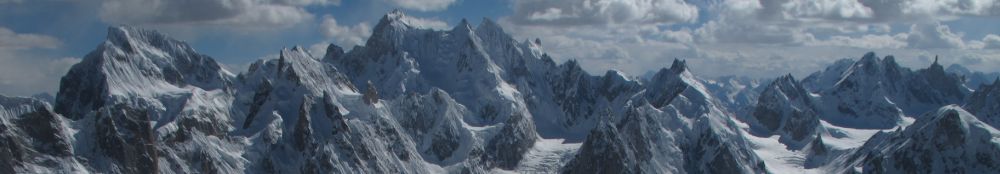
High Mountain Asia hosts the largest glacier concentration outside the polar regions. These glaciers are important contributors
to streamflow in one of the most populated areas of the world. Past studies have used methods that can provide only
regionally averaged glacier mass balances to assess the High Mountain Asia glacier contribution to rivers and sea level
rise. Here we compute the mass balance for about 92% of the glacierized area of High Mountain Asia using time series
of digital elevation models derived from satellite stereo-imagery. We calculate an average region-wide mass balance of
-16.3 ± 3.5 Gt/yr (-0.18 ± 0.04 m w.e./yr) between 2000 and 2016, which is less negative than most previous estimates.
Region-wide mass balances vary from -4.0 ± 1.5 Gt/yr (-0.62 ± 0.23 m w.e./yr) in Nyainqentanglha to +1.4 ± 0.8 Gt/yr
(+0.14 ± 0.08 m w.e./yr) in Kunlun, with large intra-regional variability of individual glacier mass balances (standard
deviation within a region ~0.20 m w.e./yr). Specifically, our results shed light on the Nyainqentanglha and Pamir glacier
mass changes, for which contradictory estimates exist in the literature. They provide crucial information for the calibration
of the models used for projections of future glacier response to climatic changes, models that currently do not capture the
pattern, magnitude and intra-regional variability of glacier changes in High Mountain Asia.
|